
Shopper has a dedicated dashboard that offers detailed reports of earnings, traffic, clicks, sales, and all-time revenue. All the stats are displayed with concise visual summaries with each overview presented with graphical statics. This makes it easier for you to see how their Shopper profile has been performing at a select time period. Analyzing the changes to metrics over time can help you get a clear picture of how your products and collections are performing.
Learn more about Shopper Earnings Dashboard Analytics:
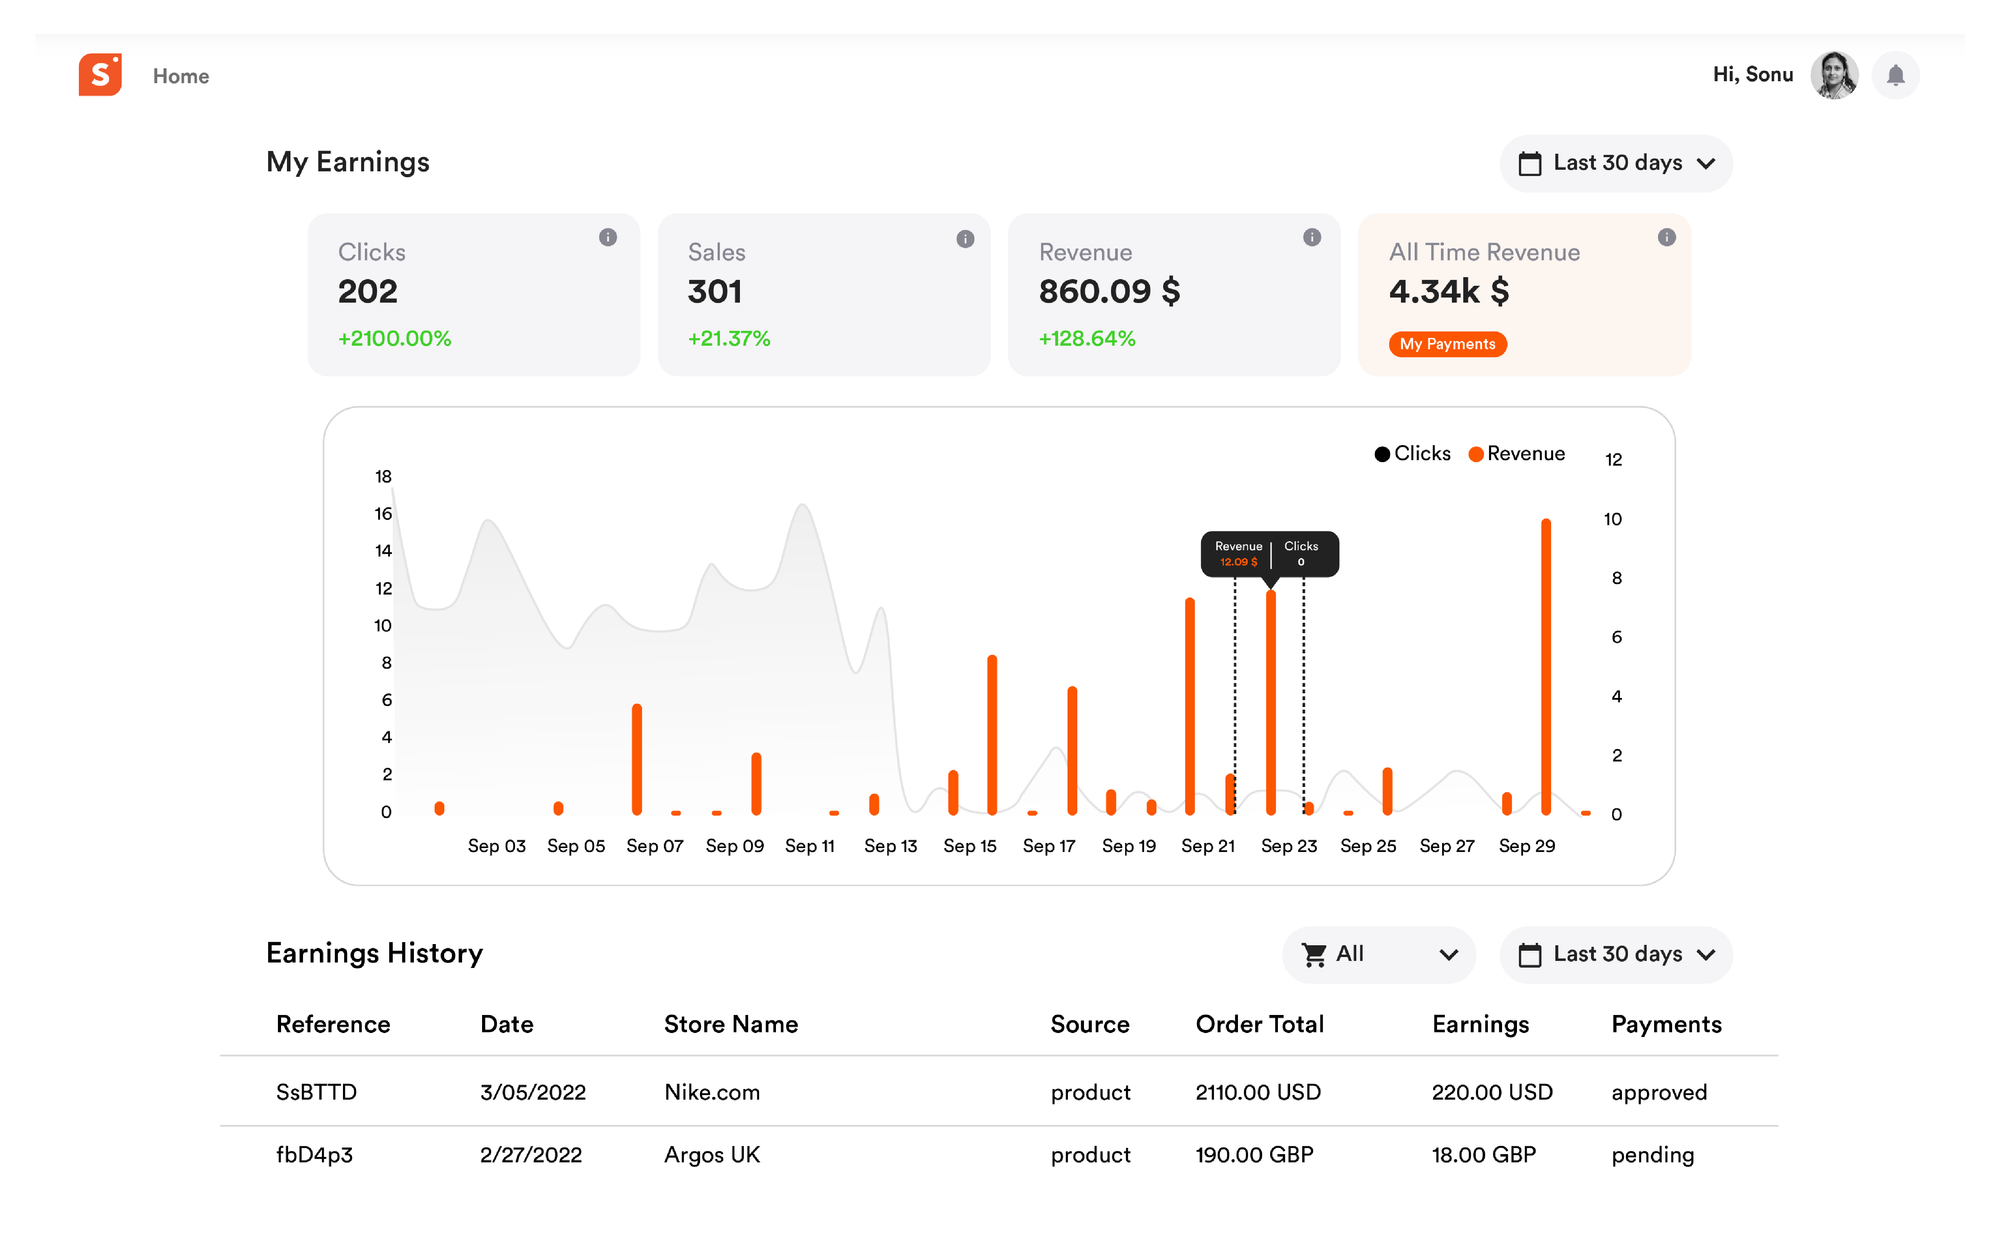
- Clicks
- Sales
- Revenue
- All Time Revenue
Clicks
Clicks are the total number of clicks that your profile generated in a selected time period. You can select a timeframe in dates, weeks, and months to see the overall clicks that took place in the selected time interval.
Sales
If you have a profile that is active in adding product recommendations, and collections, chances will be always high for you to have plenty of sales from your product recommendations. You earn commissions for each sale, and you will get an idea about this from the number of clicks you generate. All clicks that convert to purchases can be tracked through the sales graph.
Revenue
Sharing is caring, and when you share product recommendations, coupons, and deals on Shopper, that help a user in the community, you get rewards from us. Yes, that’s right, for every successful attempt that you make to reward a discount through code, coupon, and product recommendation, you get earnings. You can track that through the Revenue graph.
All Time Revenue
All-time revenue is an extended version of revenue. While the revenue analytics option only shows you the revenue you generated in a specific time frame, all-time revenue shows creators, the overall/total revenue they managed to generate after creating their Shopper profile.