
YouTube Analytics: 10 Metrics That You Should Track
Not sure about how YouTube Analytics work? We have you covered with 10 YouTube Analytics metrics that you need to start using today!

Unlocking the true potential of YouTube Analytics is one of the fastest ways to grow as a creator on YouTube.
That's probably one of the reasons why you are here and reading this.
Don't worry, we are here to help and have you covered with everything that you, as a creator need to know about YouTube Analytics.
Following this simple guide on 10 metrics that you should track will help you take your YouTube channel to the next level. You will see a massive spike in growth and discoverability for your YouTube journey by focusing on these metrics.
Keeping a close eye on these metrics can help you identify the flaws of your content.
Most importantly, it can help your overall content improve. By overcoming minor flaws, your content will end up looking more polished and attract more users.
Let's take a detailed look into these 10 metrics that you should track on YouTube Analytics.
1. Watch Time
Watch time is the total amount of time that viewers spend watching your content on YouTube.
The higher amount of watch time your videos have, the better your chances will be to get your video ranked. Channels that generally have more watch time compared rank better than channels with more videos, subscribers, and content.
Plus, you also need to complete 4000 hours of watch time to be eligible to apply for YouTube Partner Program.
Only channels that have a minimum of 1,000 subscribers, and 4,000 watch hours are eligible to get their content monetized.
That's why it's very important for creators to monitor their watch time on YouTube and strive to always improve this metric.
Creators can improve the watch time by having catchy thumbnails, clickable titles, and interesting content. Make videos that will help viewers stay engaged throughout the entire duration to boost up your watch hours instantly.
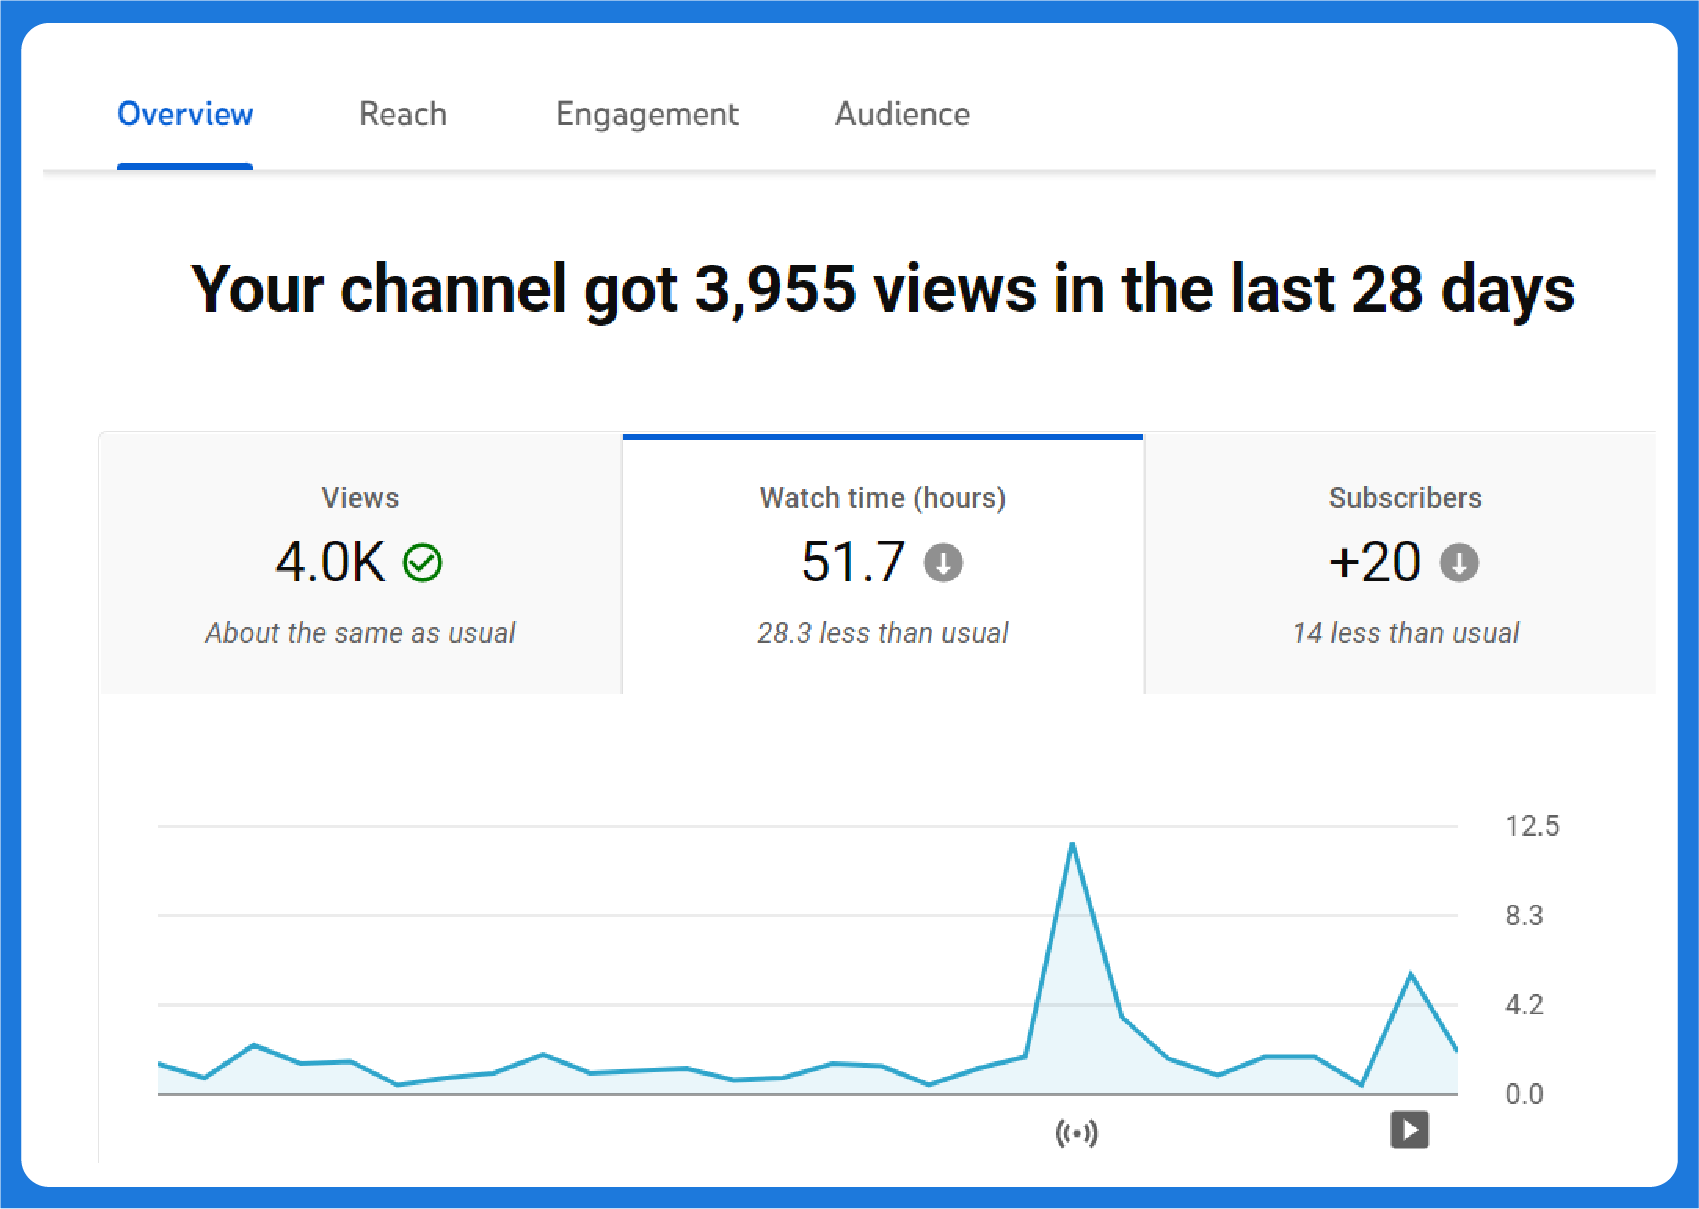
2. Views
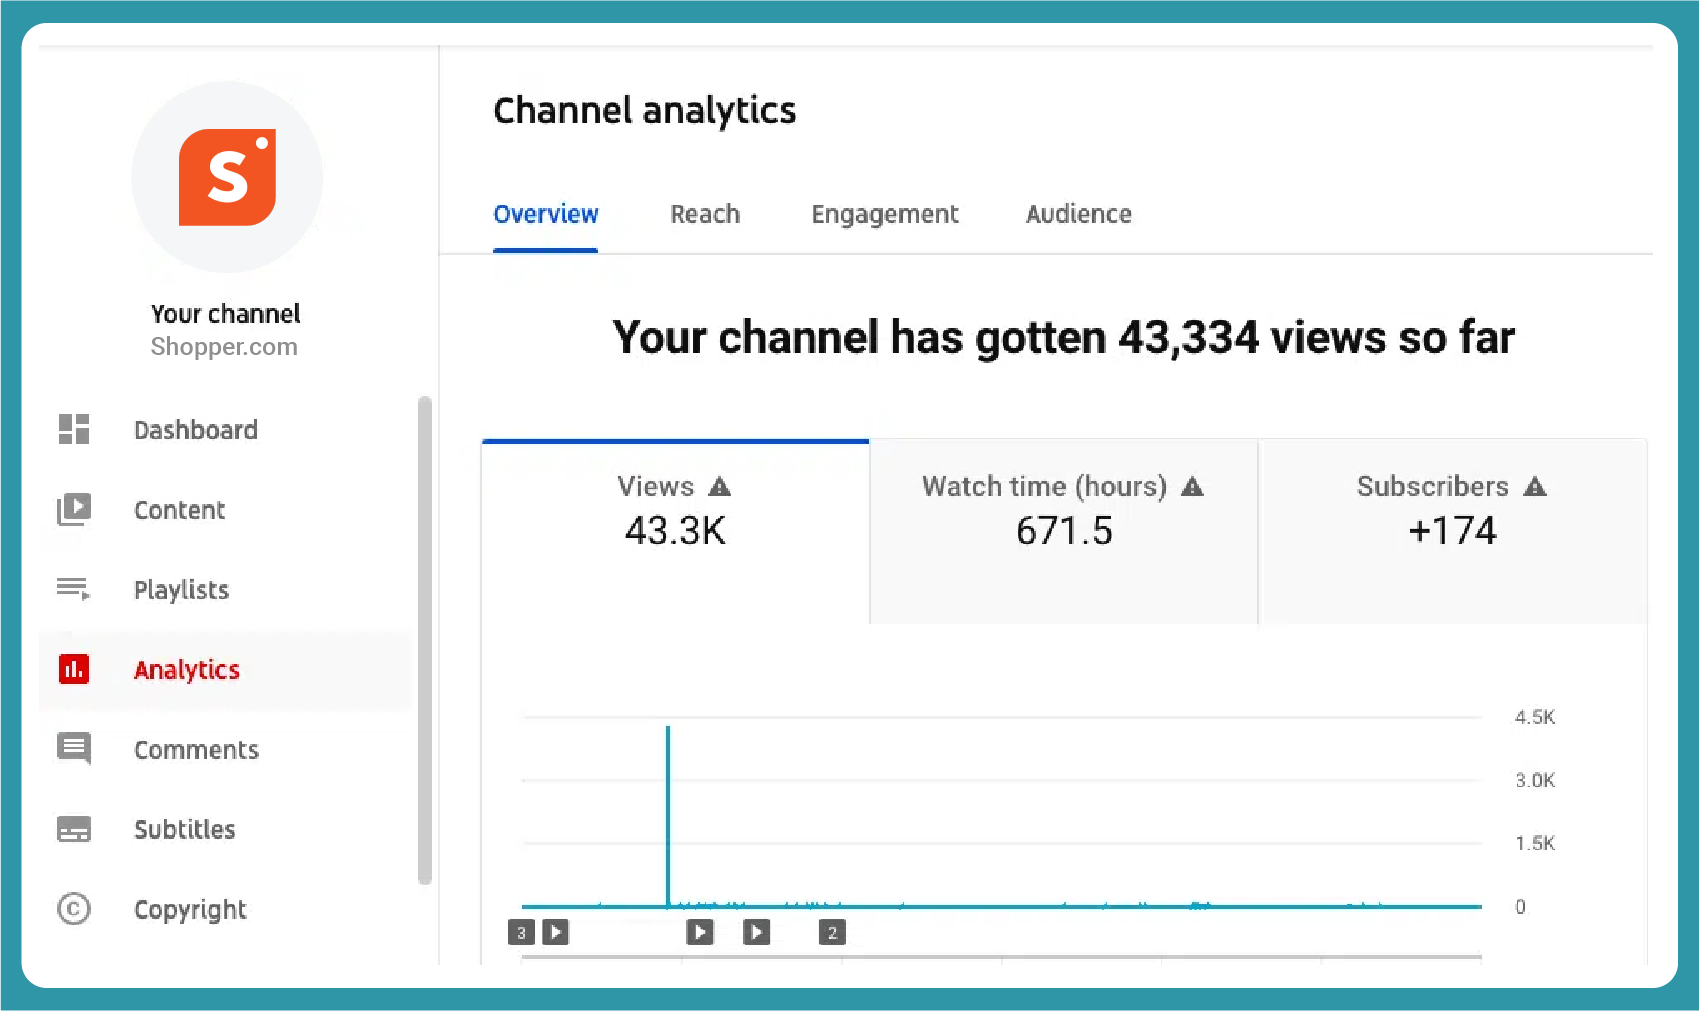
The views tab has one of the most useful graphs in terms of suggesting what content works for your channel and what does not.
As you can see from the image, the graph indicates the number of people that viewed your video.
By monitoring the spikes and dips, you get a clear picture of what your viewers love to see, and what they did not like. You can scroll to the square with a play button or numbers to see which video caused the spike or dip in views.
As a creator on a digital platform, we all continuously strive to improve the overall views and engagement.
It is important that you monitor this graph and work more on videos that bring in lots of views. At the same time, it can also be used to see if a new video topic works or not.
YouTube Analytics also lets you change a time frame and see how videos are performing over shorter and longer intervals.
Spend some time to curate a list of videos that work and videos that don't. Make more videos based on videos that work, and focus the least on a similar topic of videos that don't bring in views.
3. Audience Retention
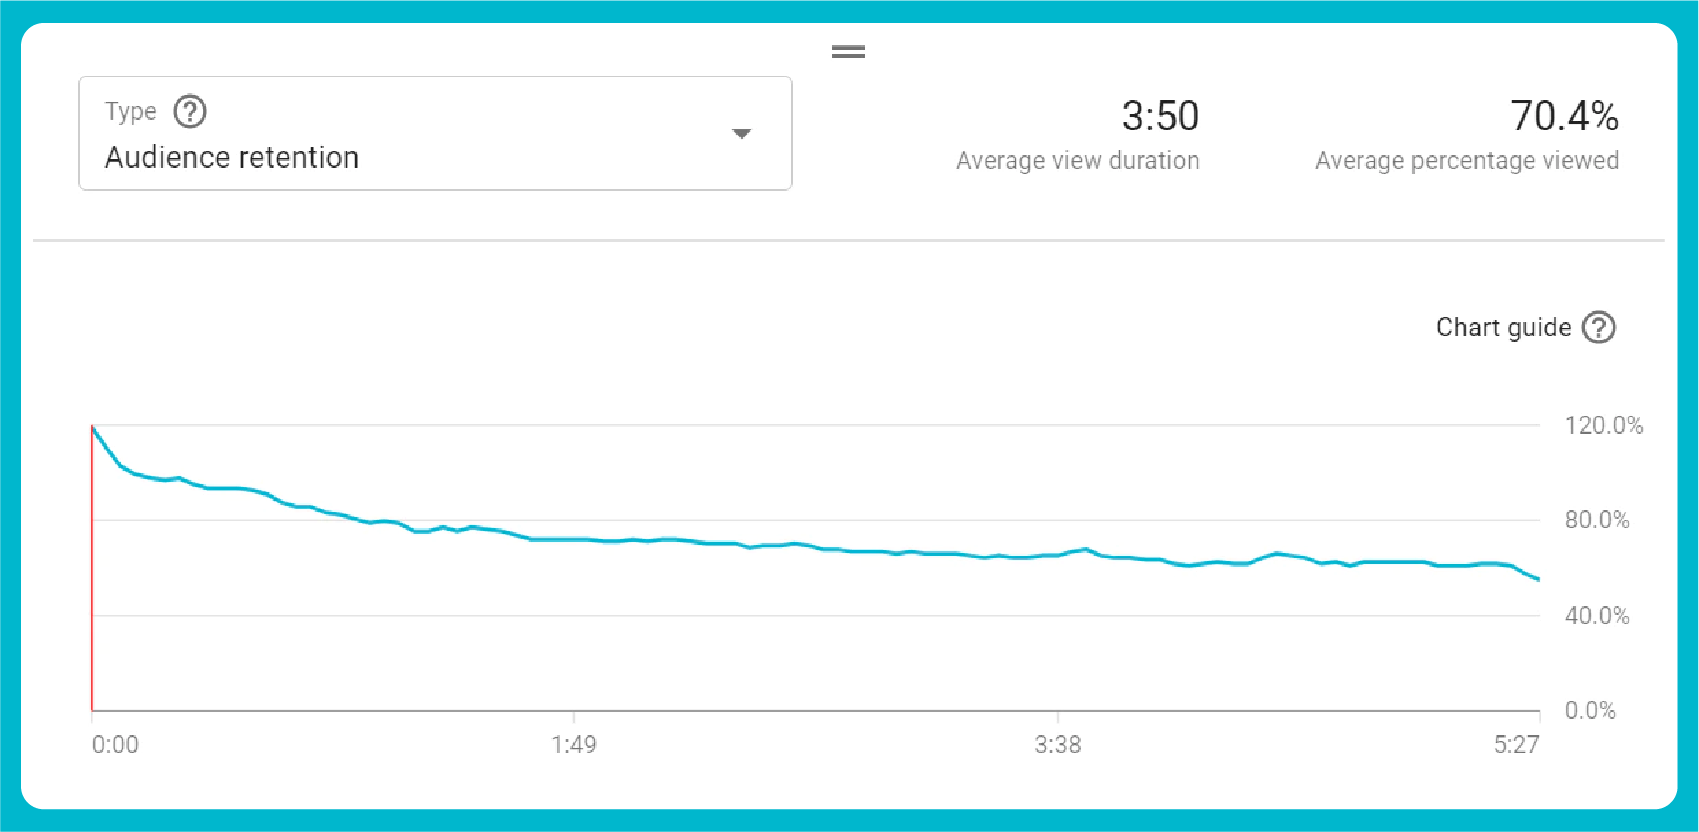
Audience retention is one of the most detailed graphs in analytics that lets you review your video up close.
The audience retention graph is a moment-by-moment chart that features an average percentage of people that watched viewed each second. It can be used to analyze where viewers start to drop off from your video.
It's easy to draw a pattern of your channel and see what brings in more views and what makes people lose interest and drop views.
The spikes and dips also suggest parts of the video where most people from your total views skip or fast forward. By making efforts to improve the content at these time frames can help you generate more views and watch time.
If you notice a significant drop at the time the intro screen pops up, it could be that people are too familiar with your current intro.
Consider using a different intro and see if the change is reflected in the audience retention graph.
As a creator, you want people to stay interested in your content for the maximum possible duration. Make sure that you continuously improve your content and make more people stay for longer durations throughout your videos.
4. Real-time Activity
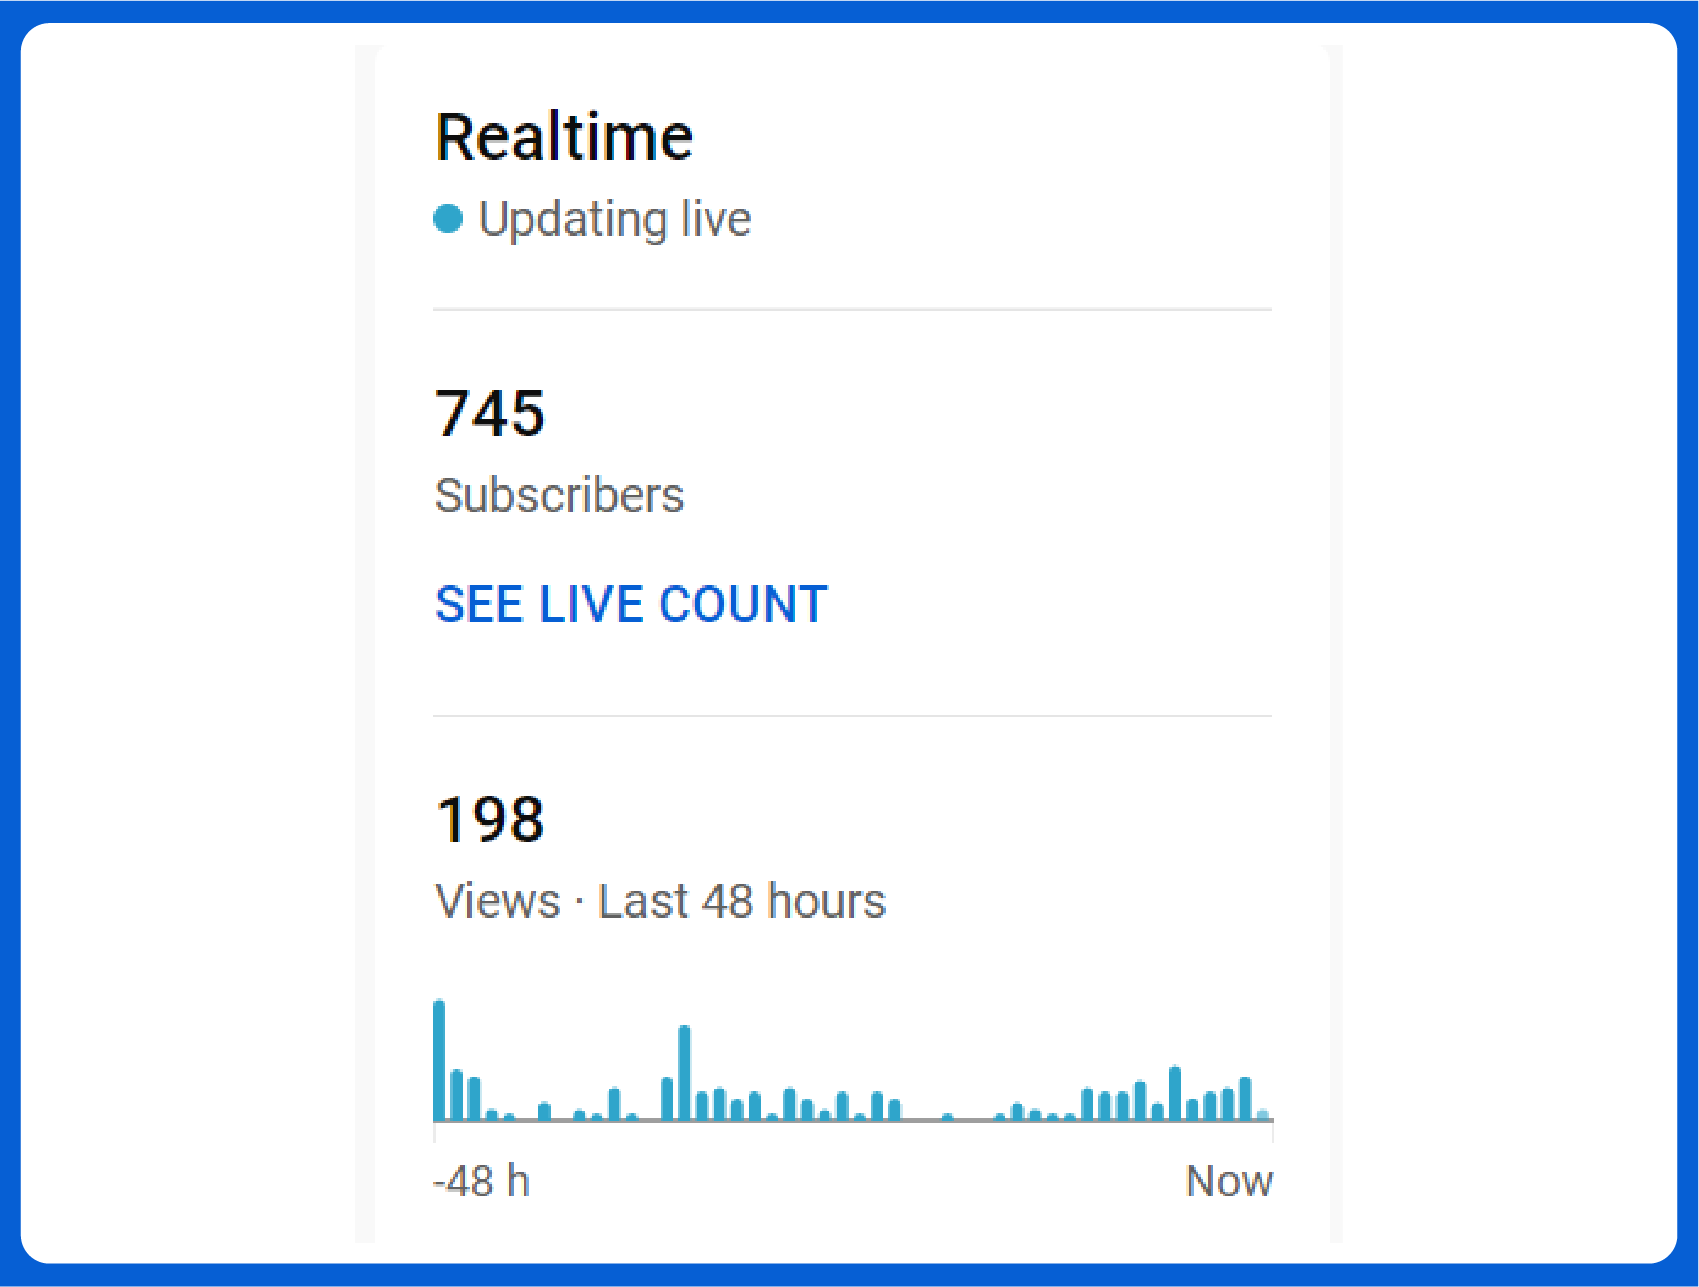
The real-time activity feature has to be the most underrated in all of YouTube Analytics.
However, as it gives out a real-time report about how your channel has been performing in the last 48 hours, it is a good metric to help you improve your overall content.
This is a feature that also helps you understand the behavior of your audience.
By monitoring this graph for a few days consecutively, you will get an idea about the time when most of your subscribers are active on the platform. You only need to keep tabs on the graph and pick out hours with the most activity.
Check the real-time activity of multiple days and see if you can pick out an hour where there is an activity every day.
Publish the next video during this interval and see if it helps improve overall views and engagement.
The Real-time activity feature also lists out the traffic source and views the respective sources generated. You can decide the format which works for you and find the best time to publish YouTube videos on your channel based on this report.
You can also see top videos that have been bringing in the most views throughout the last 48 hours.
If a video is consistently your top video, it is also best to come up with similar content to extract the maximum potential of your YouTube channel.
5. Subscriber Count
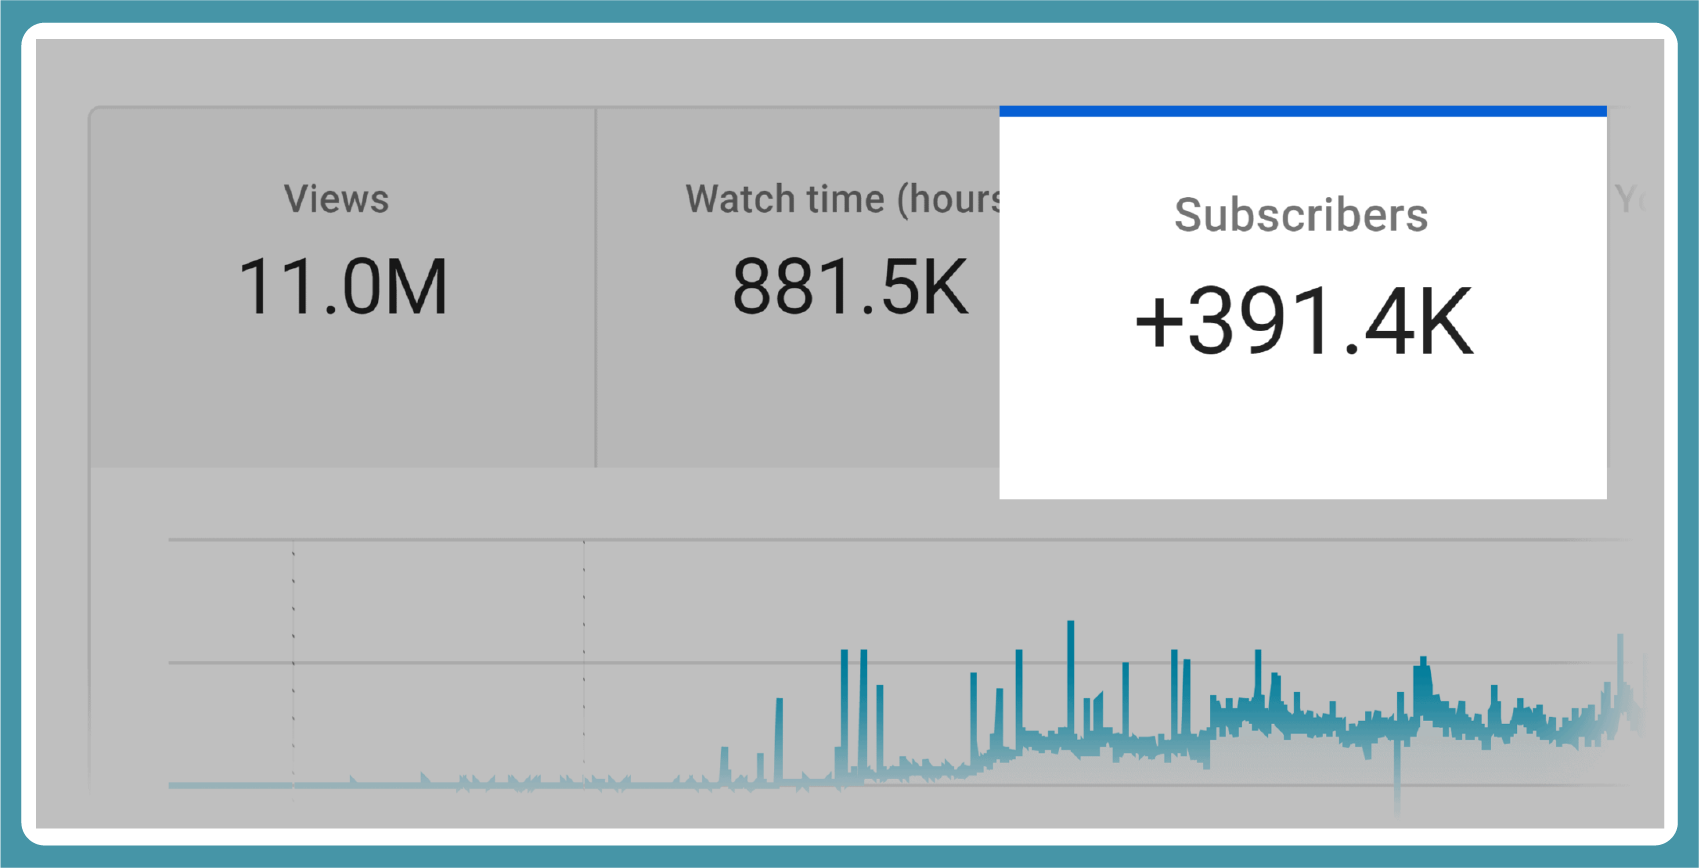
Keeping track of subscriber change is a great way to keep track of your overall progress on YouTube.
Analytics has a subscriber section with detailed sub-sections like subscription status and subscription source. These reports help you get a detailed view of subscribers gained and lost during the selected time frame.
Subscription status and source can both be accessed by clicking on the advanced options which can be accessed from the top right corner of the page.
In addition to keeping track of the subscriber count, the option also lets you keep track of where your subscribers are coming from.
You can know, if the new subscribers are from the YouTube watch page, directly from your channel, YouTube search, shorts feed, or interactive features.
The best thing about this feature is that you can get an idea about how every video directly contributes in terms of increasing or decreasing your total number of subscribers.
If you find a pattern that suggests that a particular video category is bringing in a consistent number of views, make use of it by creating videos on a similar topic.
6. Traffic Sources
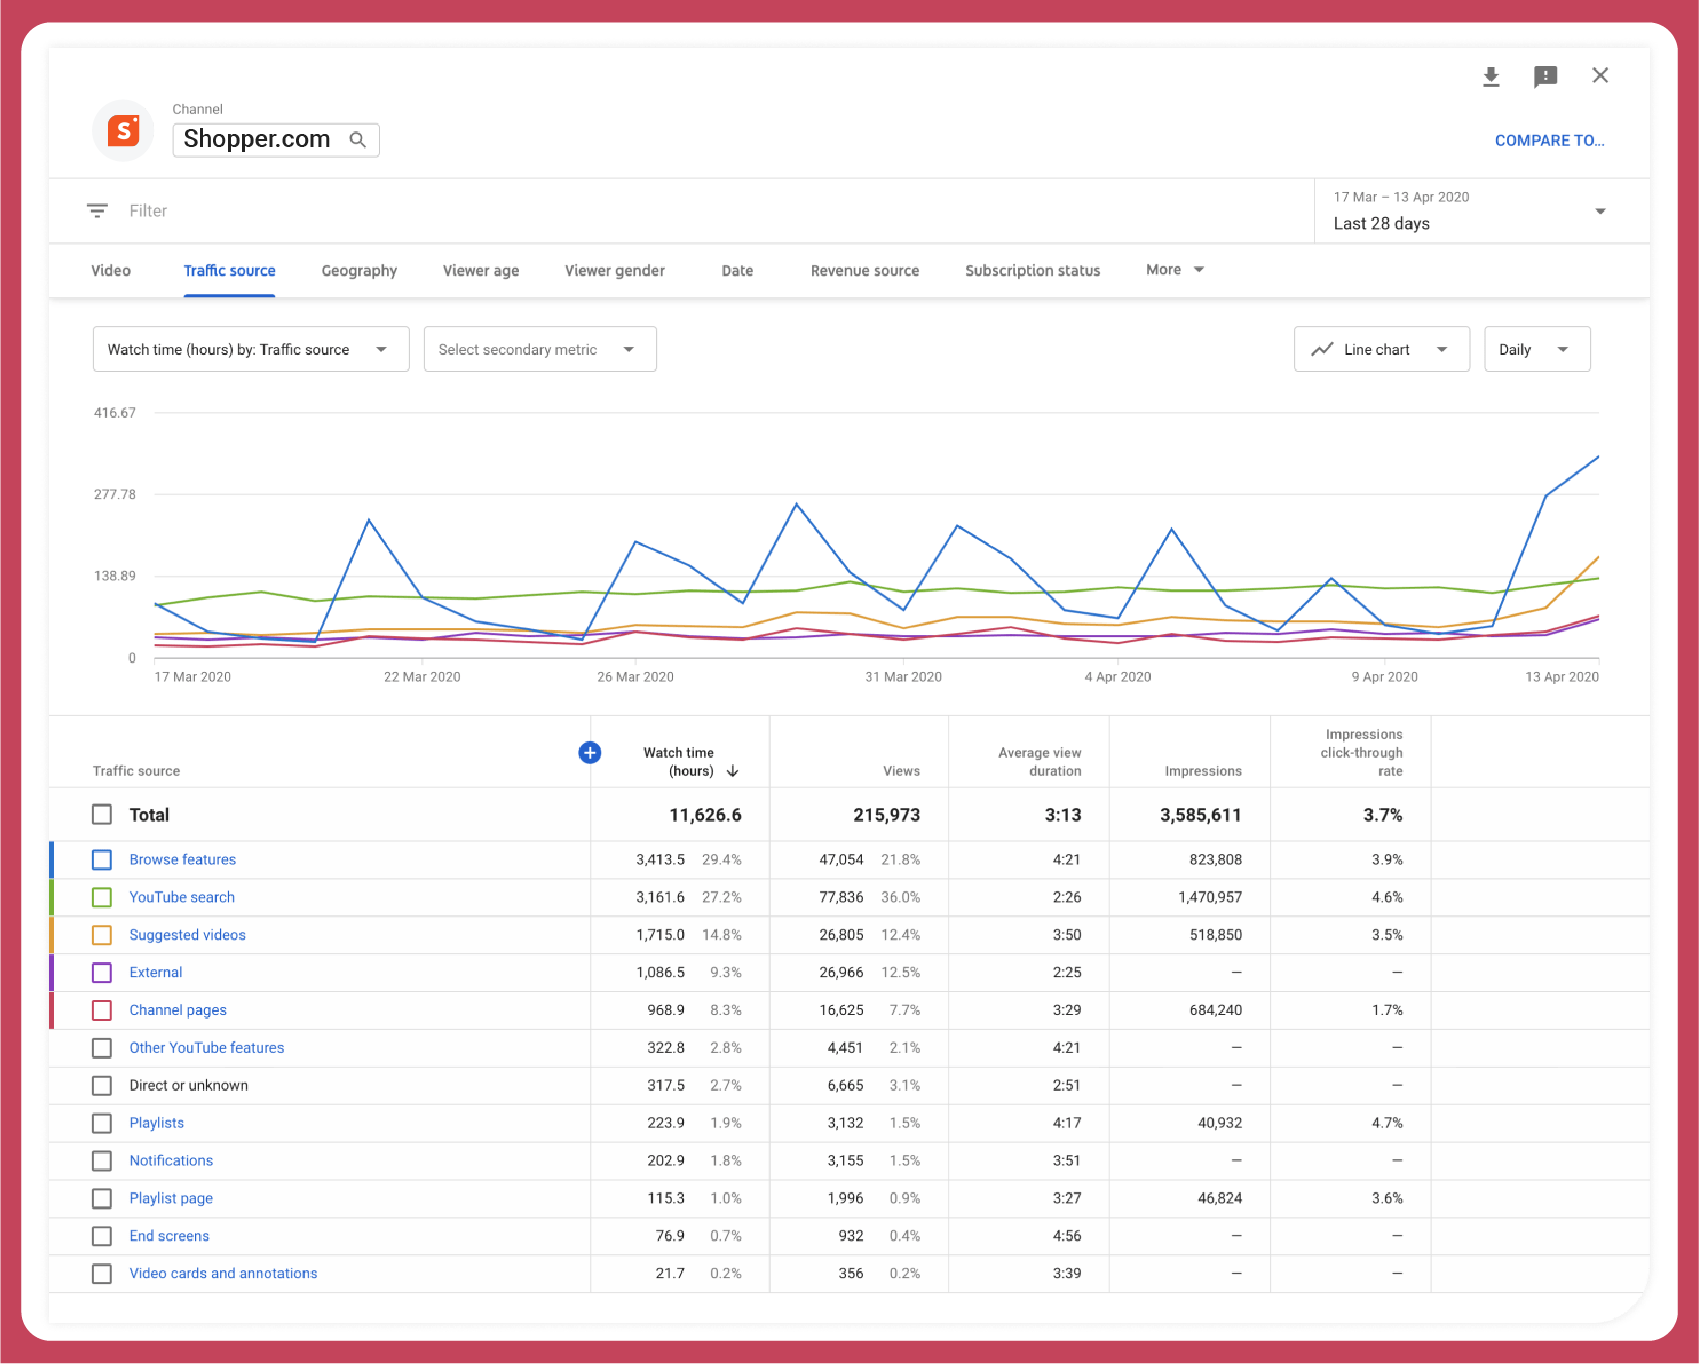
This is another one of those less explored features on analytics that guarantees great benefits for those who use this feature.
Traffic Sources lets you in on details about where your channel is attracting most of its views from.
This will help you focus more on the platform that brings in the most views and get the maximum views and generated from cross-platform sources. For instance, there are channels that grow significantly from YouTube Shorts.
There are also other YouTube Channels that depend on their ranking. Channels that have multiple videos rank for multiple keywords have better discoverability rates.
If you are making content that is similar to a general topic with other established YouTubers, it is also likely that your video will end up being recommended towards the end of the other video.
This will again help improve overall traffic and engagement.
Knowing which traffic source brings in the most views for your channel can help your content optimization for future videos.
If it's YouTube Shorts that are bringing in the most traffic, focus 60% of your Channel's content on short format, and the rest on long format or regular format videos. That's why it helps to keep track of traffic sources of your YouTube channel.
7. Impressions
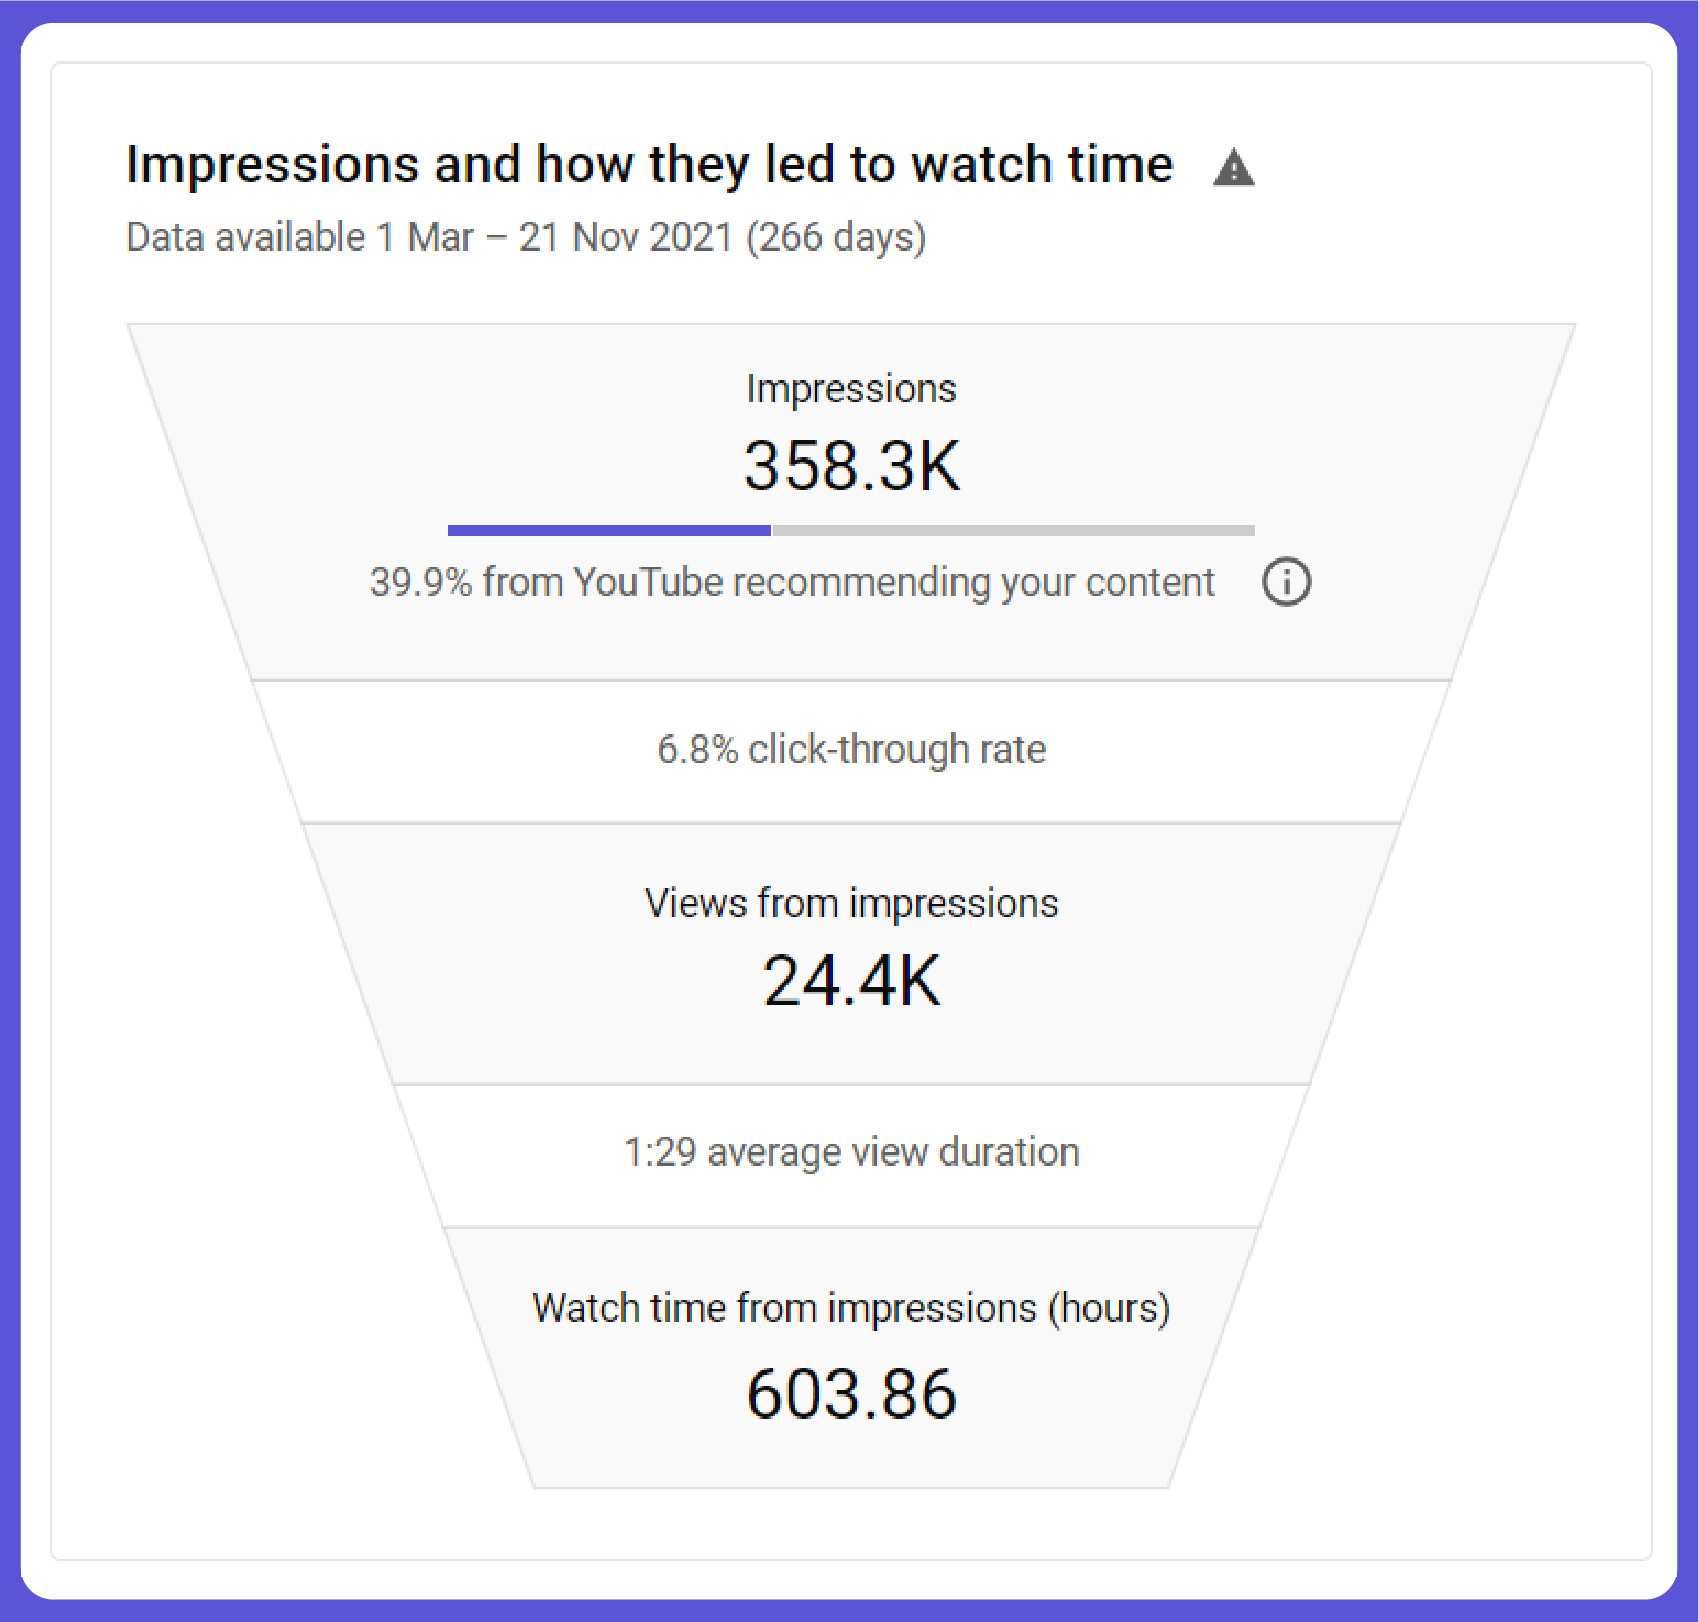
Impressions is YouTube telling you about how your videos are performing from an SEO perspective.
Too complex for your liking? Long story short - Impression refers to the number of times, potential viewers saw your video thumbnail while navigating through their feed or searching for a particular video.
If you look at analytics and see that you have a pretty high impression rate, it means that you are doing the SEO part right.
However, if you have a relatively lower rate of impressions, it's high time that you started focusing more on the search engine optimization part. Try to add more relevant keywords in your video title and description.
Spend time to work on a thumbnail, that does not give away too much about the video topic, but adds just about enough details to raise the curiosity.
You can monitor if the changes are having a positive impact by keeping tabs on the changes in the number of impressions.
A great way to get guaranteed results is to find videos that are related to the content of your video and rank on the subsequent search topic. Check out the video tags they are using and see to it that you add similar tags.
8. Demographics
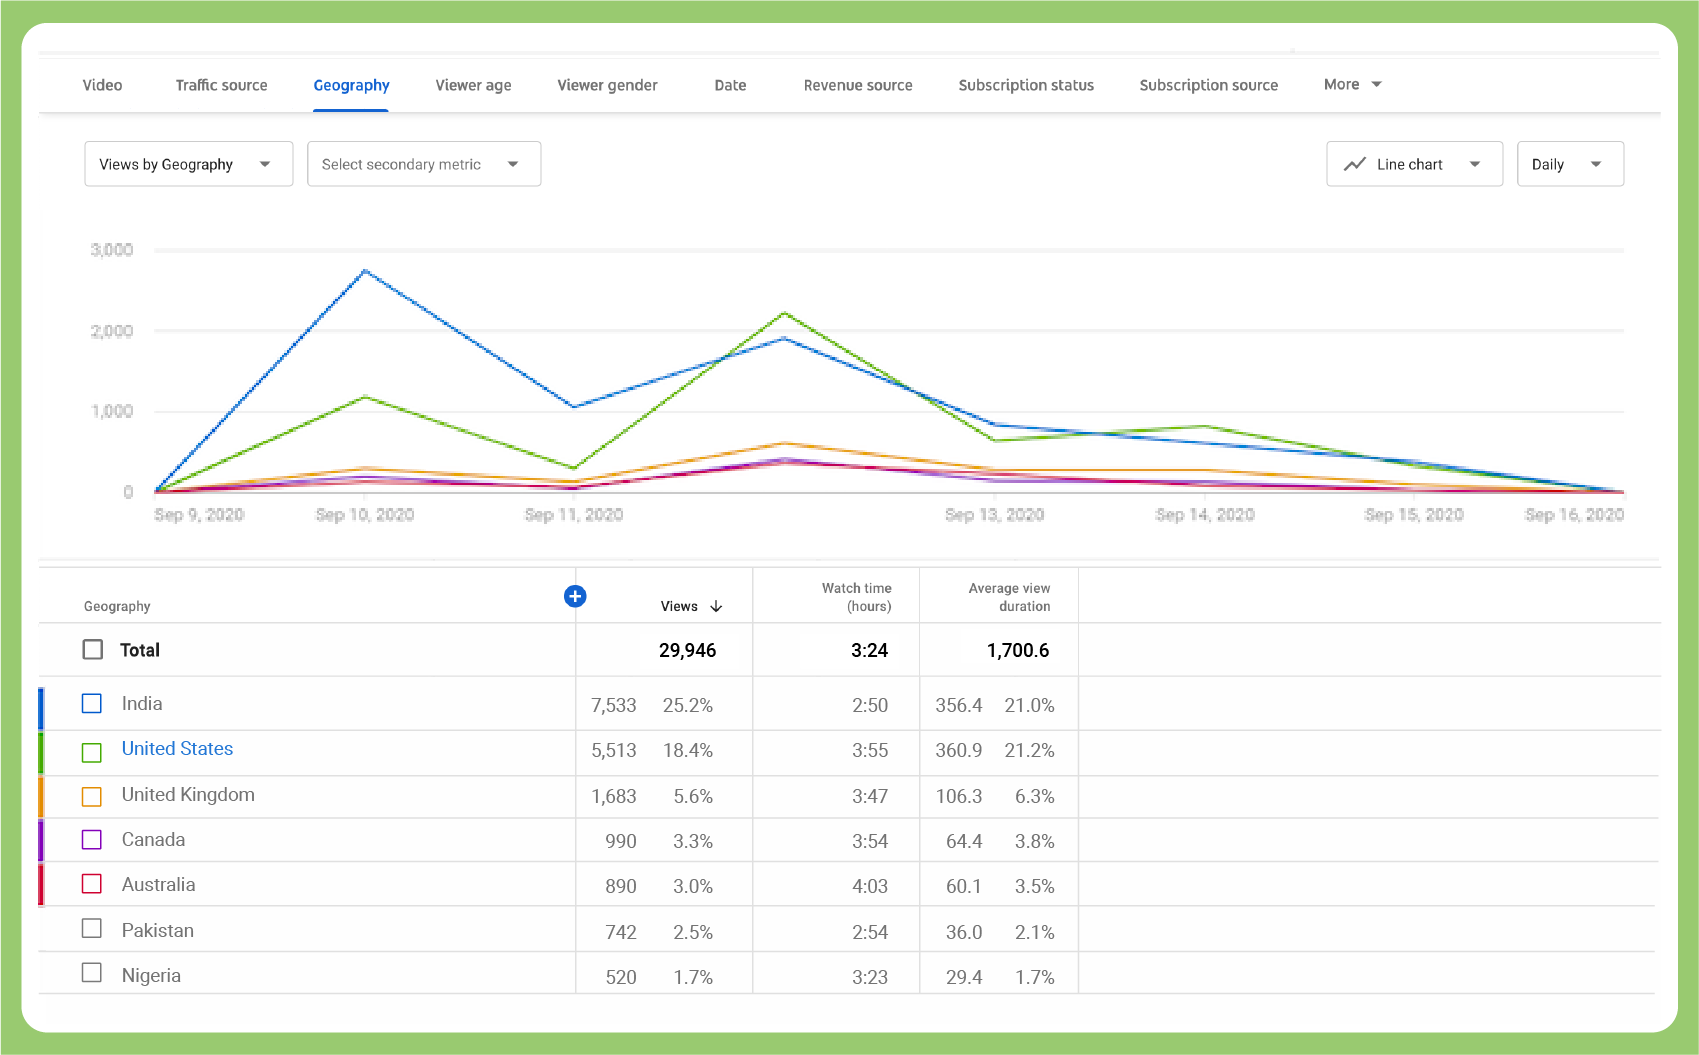
Knowing your audience is a key to successful growth on YouTube.
Analytics has you covered for that part as well, with a dedicated demographics tab that lets you understand where your audience comes from.
So how does this help in your YouTube channel's overall growth?
For starters, you get to know if you need to add subtitles to all your videos or not. If there is a large percentage of visitors from foreign countries, you can consider adding subtitles for every video.
You can also decide which all languages of subtitles you need to add based on the countries from which people view your video.
Demographics also help a lot in affiliate marketing and product endorsements. There are affiliate products that have region-specific affiliate codes which can help you improve your overall revenue from videos to the next level.
However, if you are unsure about where your visitors are coming from, you will be unable to convert all this traffic into potential revenue.
Having a clear understanding of demographics can therefore help to improve the overall growth of your YouTube channel.
9. Unique Viewers
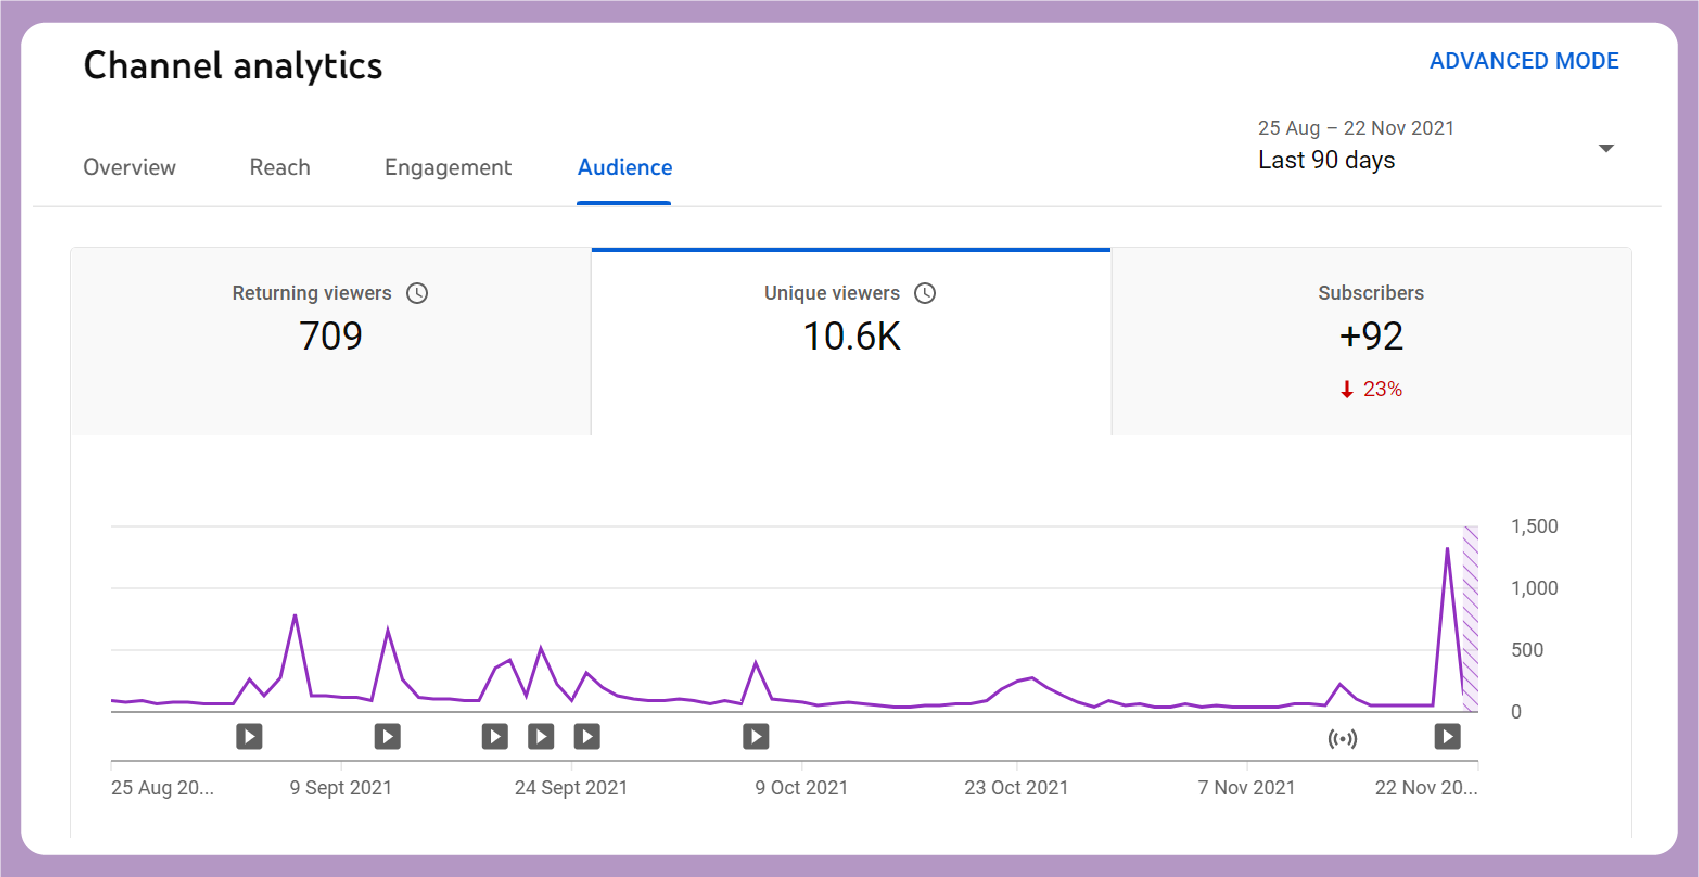
Unique viewers are the number of people that watch your video at least once over the designated time you select.
No, don't think we made a mistake. Viewers that we covered above also have a similar outlook, however, YouTube will register views from the same viewer more than once.
However, when it comes to uniqueness, regardless of how many times you view it, it will only be considered as one unique view.
This makes the unique viewers metric a really powerful tool that lets you get a clear understanding of how big your audience size is. The only limitation with the feature is that you are only able to set a maximum time frame of 90 days.
On the flip side, it does help you in understanding the overall performance of your latest videos.
You can also time frames based on weekly uploads and see which videos bring more views and which don't. This can be used to focus more on content that has the most impact.
To access Unique Viewers, head over to the Analytics menu, and click on the Audience tab, which is the fourth option on the list. Make sure that you set the timeframe under the maximum of 90 days.
The total number of unique viewers is only available for periods of up to 90 days to ensure data quality.
10. Engagement
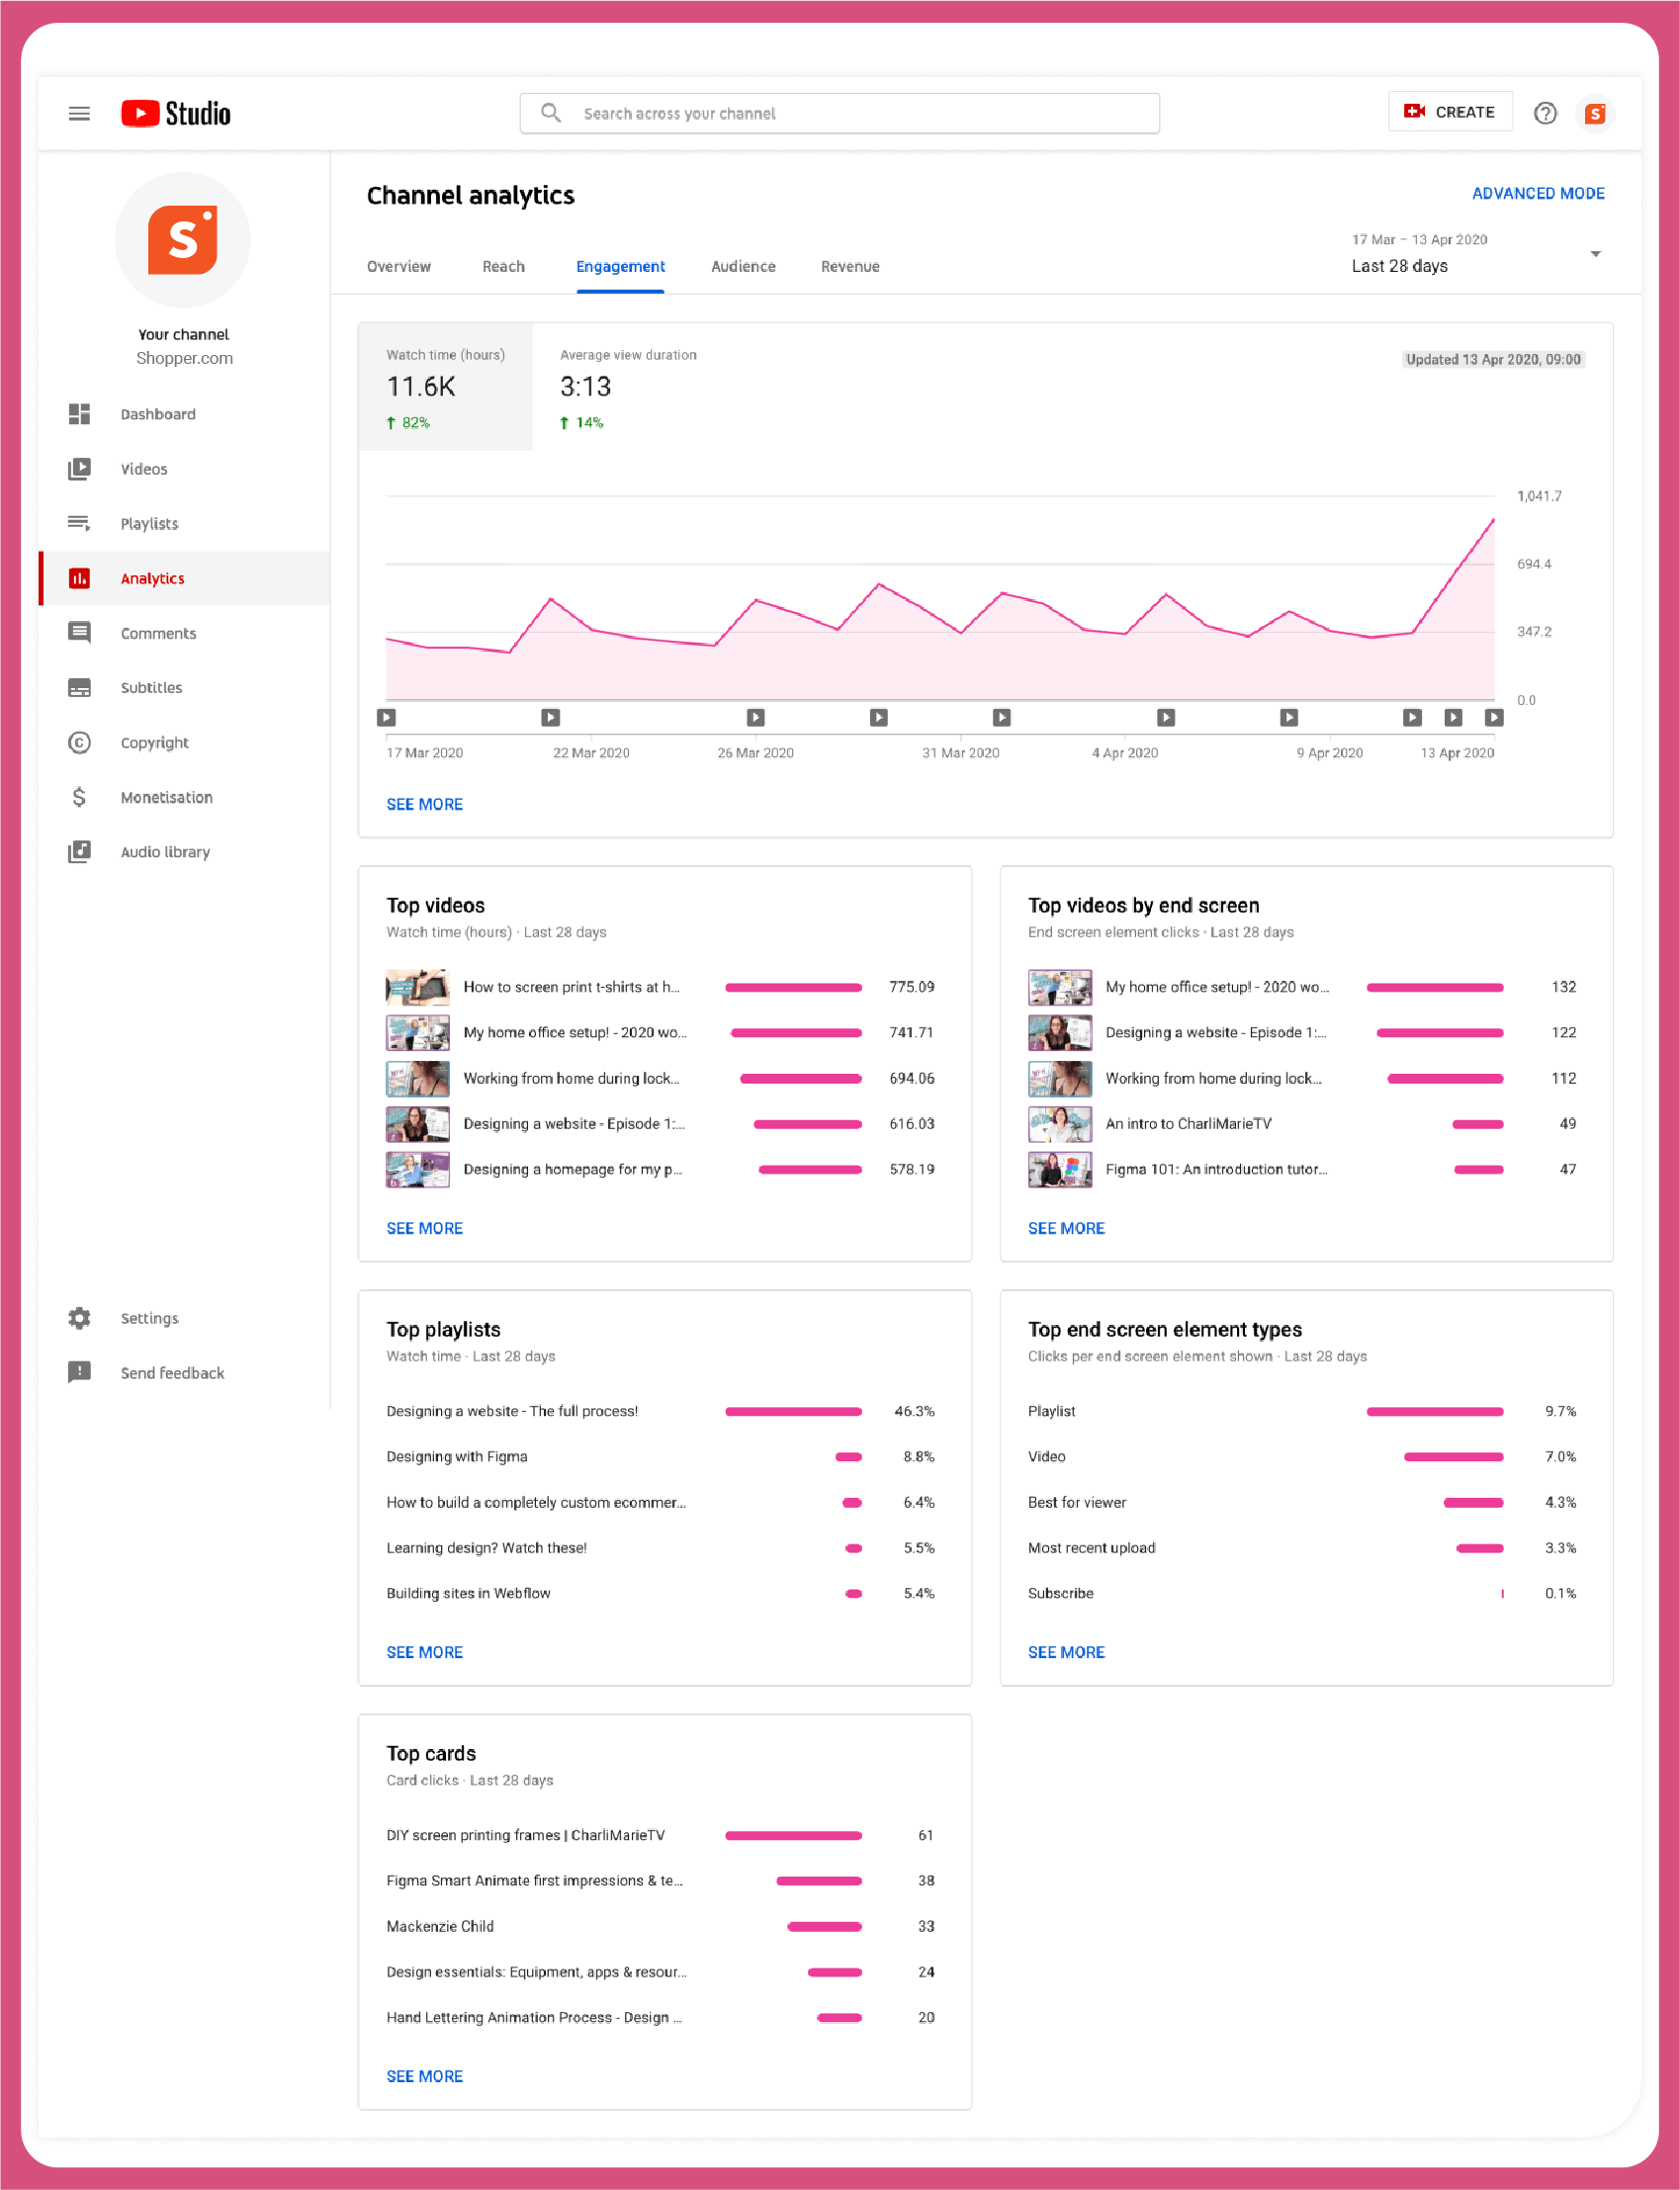
In addition, to watch time that we covered before, Engagement is a broader metric with other features.
You can access useful reports like average view duration, top videos, top posts, top playlists, and top videos by end screen, top cards, and top-end screen element types. You will also get a list of videos that have key moments for audience retention.
This is one section that can definitely help you come up with better engagement rates instantly.
All of the reports that are listed under this option are accompanied by a see more option that immediately takes you to the advanced mode option with detailed graphs.
That means, you have multiple options to review the performance of your content from several angles and see how small building blocks like end screen elements, and cards that can be used to redirect users to other videos are working for your channel.
They also let you know what type of cards work for your channel, and what element have the most chances of conversion when it is combined with an end screen card.
Spend some time to go through all the reports available on engagements and deploy the changes on your future content to reap the rewards. With the right changes, you can easily convert the engagement into consistent growth and new subscribers.
To Summarize,
YouTube Analytics is a powerful tool that offers a lot of power to the creators.
It is also available to all the creators from day one and lets you monitor the performance of your YouTube channel from the get-go. However, many creators fail to make use of the interface.
Hopefully, the tips we covered can help you get a better picture and idea about how you can make use of all the creators' tools that Analytics offers to the creators.
Use the Analytics tool to understand where your content is struggling and overcome the challenges to take your channel to the next level.